Home sales grew steadily month over month with 776 homes changing hands via the Multiple Listing Service® (MLS®) of the London and St. Thomas Association of REALTORS® (LSTAR). That was up 8.8%, compared to May 2025, and an increase of 138 more units sold over the previous month.
“It’s an encouraging sign, as we head into the summer season,” said Robin Tiller, LSTAR’s 2026 Chair. “Since the start of the year, we’ve consistently seen month-over-month gains in sales. Activity is right on par with the last five years.”
Average sales price took a healthy jump in May. It was $662,292, up from $618,665 in April. The London region saw noticeable month-over-month gains. In London South, the average sales price was $677,226, up from $626,840 the previous month, as well as London East, with an average price of $476,844, up from $450,793 in April.
“The sales-to-new listings ratio was 42.8%, up from 36% recorded in April,” Tiller said. “According to the Canadian Real Estate Association (CREA), a ratio between 45% and 65% indicates conditions of a balanced market. We also saw inventory levels beginning to stabilize in May, with 4.3 months of inventory, down from 4.5 months of inventory compared to the same time in 2025. That’s down from the 5 months of inventory recorded in April.”
The table below displays May’s average prices and MLS® HPI Benchmark Prices in LSTAR's main regions.
Area | May 2026 | May 2026 |
|---|---|---|
| Central Elgin | $664,100 | $670,415 |
| London East | $445,400 | $476,844 |
| London North | $633,400 | $733,310 |
| London South | $567,800 | $677,226 |
| Middlesex Centre | $788,200 | $1,115,644 |
| St. Thomas | $524,900 | $568,008 |
| Strathroy-Caradoc | $735,900 | $600,930 |
| LSTAR | $570,000 | $662,292 |
The HPI benchmark price reflects the value of a “typical home” as assigned by buyers in a certain area based on various housing attributes, while the average sales price is calculated by adding all the sale prices for homes sold and dividing that total by the number of homes sold. The HPI benchmark price is helpful to gauge trends over time since averages may fluctuate by changes in the mix of sales activity from one month to the next.
The following table displays May’s benchmark prices for all housing types within LSTAR's jurisdiction and shows how they compare with those recorded in the previous month and three months ago.
MLS® Home Price Index Benchmark Prices | |||
|---|---|---|---|
Benchmark Type | May 2026 | Change Over | Change Over |
| LSTAR Composite | $570,000 | ↑0.5% | ↑1.5% |
| LSTAR Single-Family | $623,700 | ↑0.3% | ↑1.1% |
| LSTAR One Storey | $563,800 | ↑0.1% | ↑1.9% |
| LSTAR Two Storey | $672,100 | ↑0.4% | ↑0.5% |
| LSTAR Townhouse | $438,900 | ↓2.3% | ↓2.6% |
| LSTAR Apartment | $342,000 | ↑4.1% | ↑4.4% |
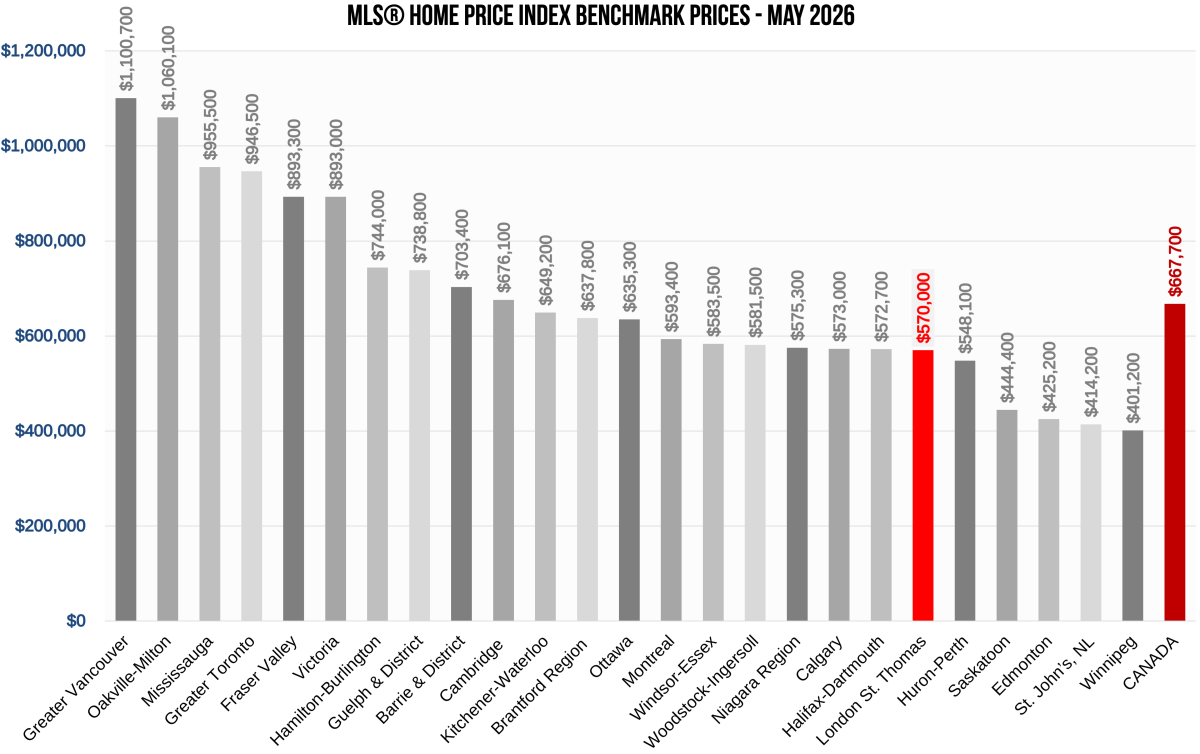
The chart below shows the most recent HPI benchmark prices across the country, courtesy of CREA.
According to a 2025 study1 by Altus Group, the average housing transaction in Ontario generated approximately $124,200 in spin-off spending per transaction, between 2022 to 2024. These include such expenses as legal fees, appraisers, moving costs, new appliances, and home renovation expenses.
“When we look at May, that means potentially generating more than $96 million back into the economy,” Tiller said.
Employment resulting from home sales is also significant, according to the Altus study. Resale housing activity created an estimated 117,610 jobs annually in Ontario from 2022 to 2024. Jobs include manufacturing, construction, skilled trades, finance, and insurance.
1Economic Benefits Generated by Home Sales and Purchases Over MLS® Systems Across Canada, Altus Group, 2025.