
PropTx has introduced the Performance Statistics Dashboard, now available in The Habistat. This dashboard provides Users access to clear, data-driven insights related to their residential sale and lease activity.
The Performance Statistics Dashboard allows:
- Individual Users to generate a free report of their residential sale and lease transaction statistics.
- Branch Managers and Brokers of Record to view branch and Brokerage level performance reports for their respective branches and Brokerage.
What's Included
The dashboard provides insights such as:
- Weighted* sales and purchase transaction volume
- Weighted* total dollar sales and purchase volume
- Median sale and purchase price
- Per cent sales and per cent purchase above list price (LP)
- Average days on market (DOM)
- Median sale price (SP) / list price (LP)
- Transaction trends by month, price range and location
*Note: Transaction volume and dollar volume are calculated on a weighted basis. For example, if two agents are listed on the same transaction, each receives 0.5 credit. All other statistics are not weighted and provide detailed analysis of sold listings.
How to Access Your Performance Stats
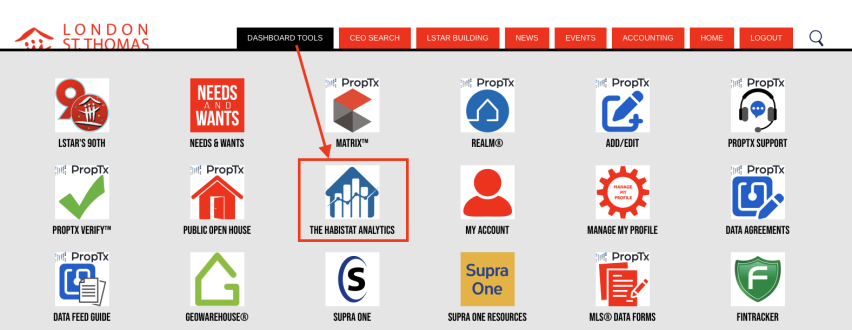
- Go to the LSTAR Member Hub, log in, then navigate to Dashboard Tools and click on The Habistat Analytics.
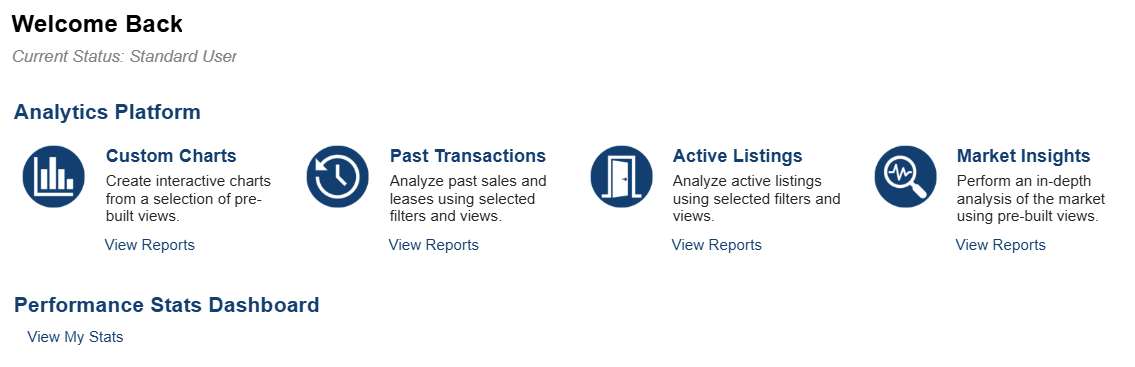
- From the Dashboard, under the Performance Stats Dashboard, click View My Stats
- Use the top menu to filter your transactions by:
- Sales or Lease
- Property Type
- Location
- Bedrooms
- Date Range

Note: Only Residential transactions are available in the initial release.
- The dashboard widgets will update automatically based on your selections.
Dashboard Features
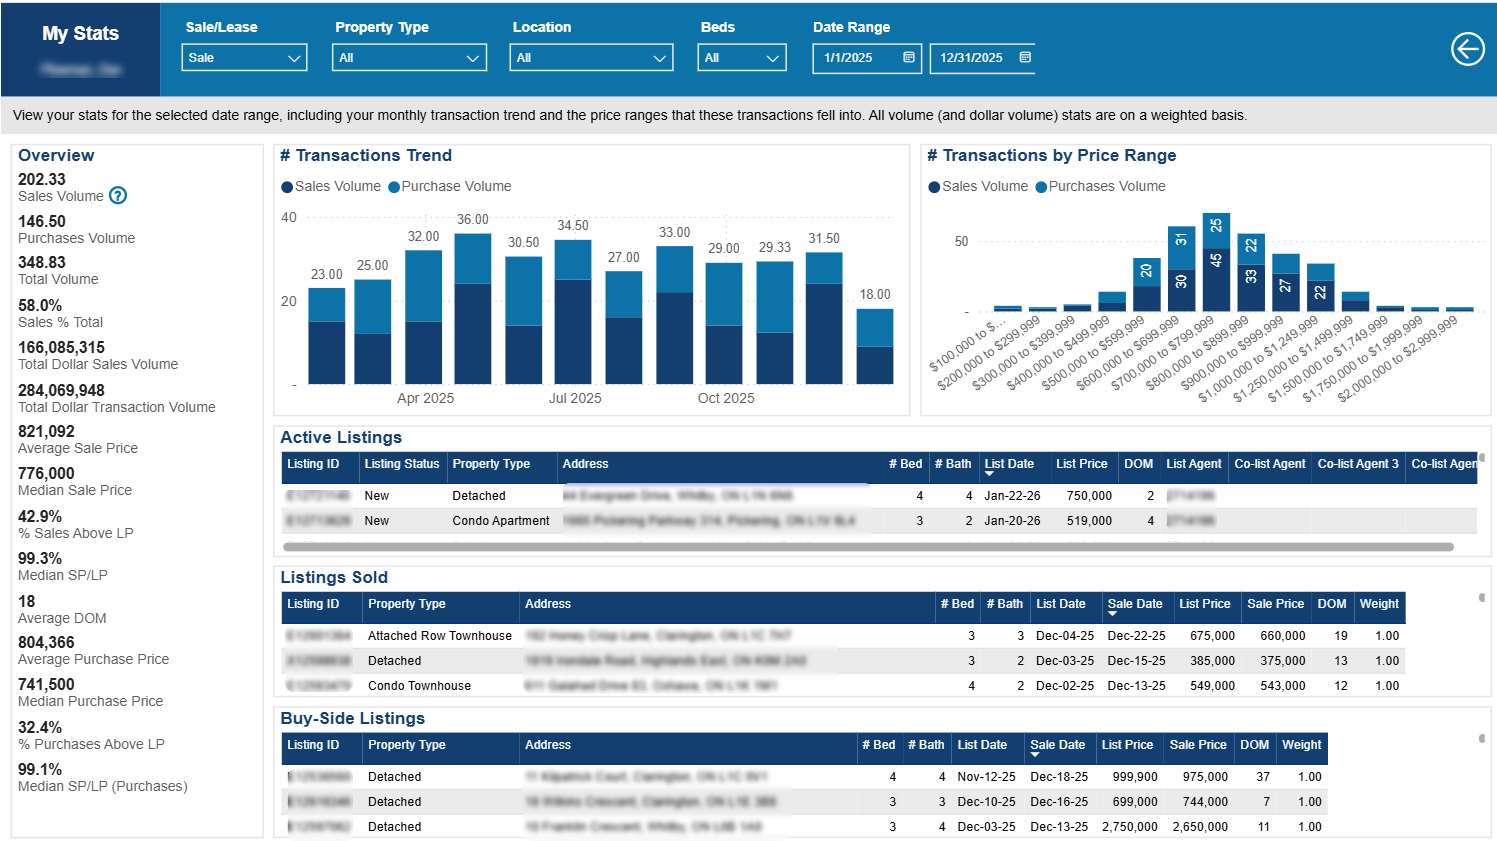
Overview
A snapshot of your sale and purchase volume (weighted), along with key dollar metrics.
Transaction Trend & Price Range
Visual breakdown of your sales and purchase activity by:
- Month
- Price range
Active Listings
A table of your current active listings.
Tip: Right-click to display this view as a standalone table or click the icon 
Listings Sold
A detailed table of your sold listing transactions, including weighted values.
Tip: Right-click to display this view as a standalone table or click the icon
Buy-side Listings
A detailed table of your purchase transactions, including weighted values.
Tip: Right-click to display this view as a standalone table or click the icon
Branch & Brokerage Reporting
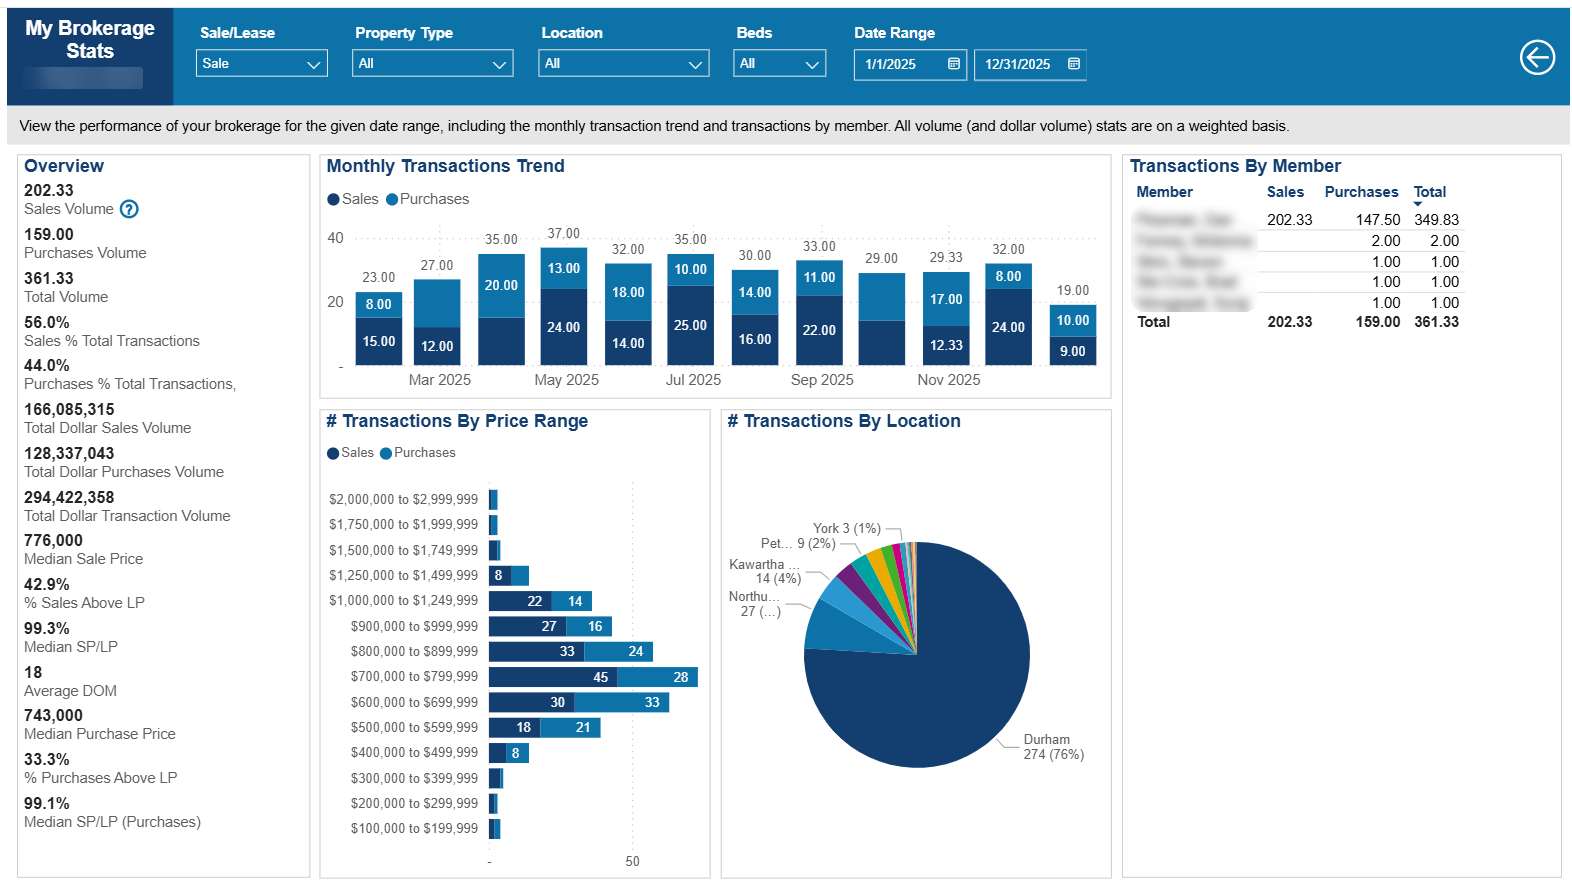
Branch Managers and Brokers of Record can access additional options on the Performance Stats Dashboard:

Branch or Brokerage dashboards track:
- Performance by price range
- Geographic location
- Individual User transactions (weighted). Tip: Right-click to display this view as a standalone table
Need help?
If you have questions about the Habistat or the Performance Statistics Dashboard, contact the PropTx Help Desk.
Email: support [at] proptx.ca (support[at]proptx[dot]ca)
Phone: 416-443-8199