
London, ON – In September, 561 homes changed hands via the Multiple Listing Service® (MLS®) of the London and St. Thomas Association of REALTORS® (LSTAR), up 5.3% compared to September 2025 and up from the previous month, which recorded 526 sales.
“The average sales price saw a jump to $611,509, from $590,550 recorded in August,” said Robin Tiller, LSTAR’s 2026 Chair. “Notably, London South and London North experienced the biggest gains in average sales price, month over month. In London South, the September average sales price was $608,872, up from the August average sales price of $567,783. In London North, the September average sales price was $704,858, up from the previous month, which was $668,345.”
The September sales-to-new listings ratio was 34.7%, down from August, which came in at 37.5%. According to the Canadian Real Estate Association (CREA), a ratio between 45% and 65% indicates conditions of a balanced market.
“The marketplace continued to show signs of a buyers’ market,” Tiller said. “With interest rates holding steady and 5.9 months of inventory, it may be an opportune time for those looking to enter the market. Your local REALTOR® is the best resource to help you navigate through the marketplace with real-time data and professional expertise.”
The table below displays September’s average prices and MLS® HPI Benchmark Prices in LSTAR's main regions.
| AREA | MLS® HPI BENCHMARK | AVERAGE PRICE |
| Central Elgin | $623,100 | $748,264 |
| London | N/A | $591,927 |
| London East | $432,300 | $456,814 |
| London North | $613,000 | $704,858 |
| London South | $550,400 | $608,872 |
| Middlesex Centre | $756,300 | $850,213 |
| St. Thomas | $496,800 | $544,865 |
| Strathroy-Caradoc | $729,500 | $669,705 |
| LSTAR | $552,500 | $611,509 |
The HPI benchmark price reflects the value of a “typical home” as assigned by buyers in a certain area based on various housing attributes, while the average sales price is calculated by adding all the sale prices for homes sold and dividing that total by the number of homes sold. The HPI benchmark price is helpful to gauge trends over time since averages may fluctuate by changes in the mix of sales activity from one month to the next.
The following table displays September’s benchmark prices for all housing types within LSTAR's jurisdiction and shows how they compare with those recorded in the previous month and three months ago.
MLS® HOME PRICE INDEX BENCHMARK PRICES | |||
| Benchmark Type | September 2026 | Change over August 2026 | Change over June 2026 |
| LSTAR Composite | $552,500 | -0.2% | -1.5% |
| LSTAR Single-Family | $600,700 | -0.2% | -2.1% |
| LSTAR One Storey | $541,300 | 0.2% | -1.3% |
| LSTAR Two Storey | $648,100 | -0.5% | -2.7% |
| LSTAR Townhouse | $421,500 | -2.1% | -2.6% |
| LSTAR Apartment | $317,100 | 0.4% | -2.2% |
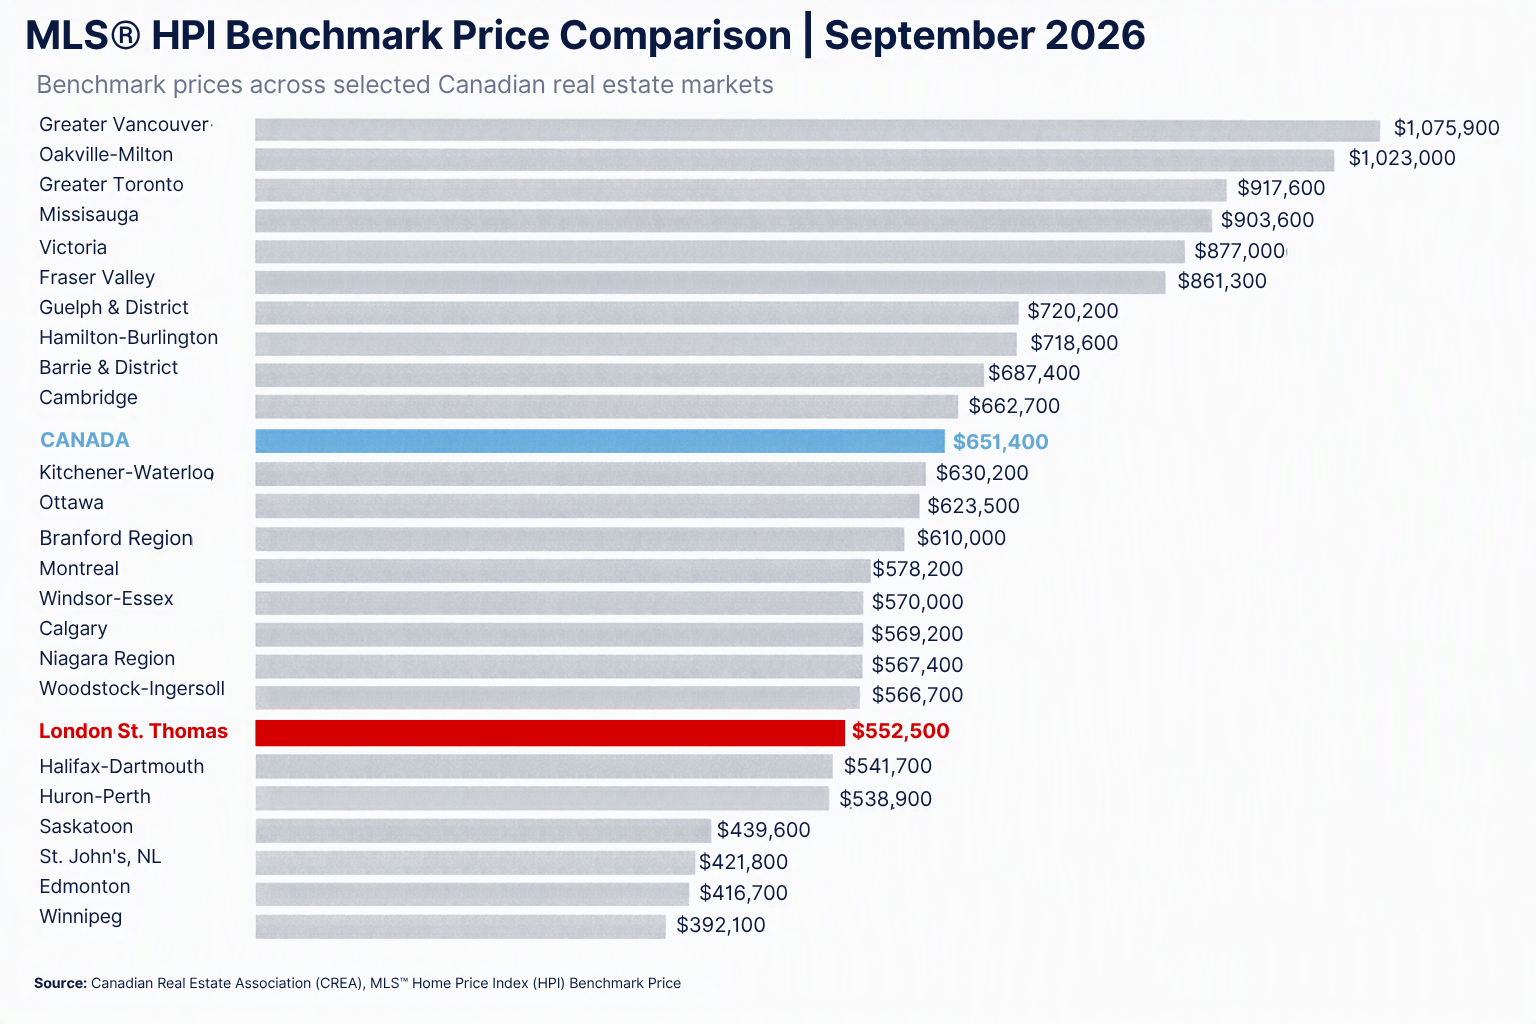
The table below shows the most recent HPI benchmark prices across the country, courtesy of CREA.
According to a 2025 study by Altus Group, the average housing transaction in Ontario generated approximately $124,200 in spin-off spending per transaction, between 2022 to 2024. These include such expenses as legal fees, appraisers, moving costs, new appliances, and home renovation expenses.
“In August, that translates into generating around $65 million across the region,” Tiller said.
Employment resulting from home sales is also significant, according to the Altus study. Resale housing activity created an estimated 117,610 jobs annually in Ontario from 2022 to 2024. Jobs include manufacturing, construction, skilled trades, finance, and insurance.
Download the full release pdf here.
[1] Economic Benefits Generated by Home Sales and Purchases Over MLS® Systems Across Canada, Altus Group, 2025